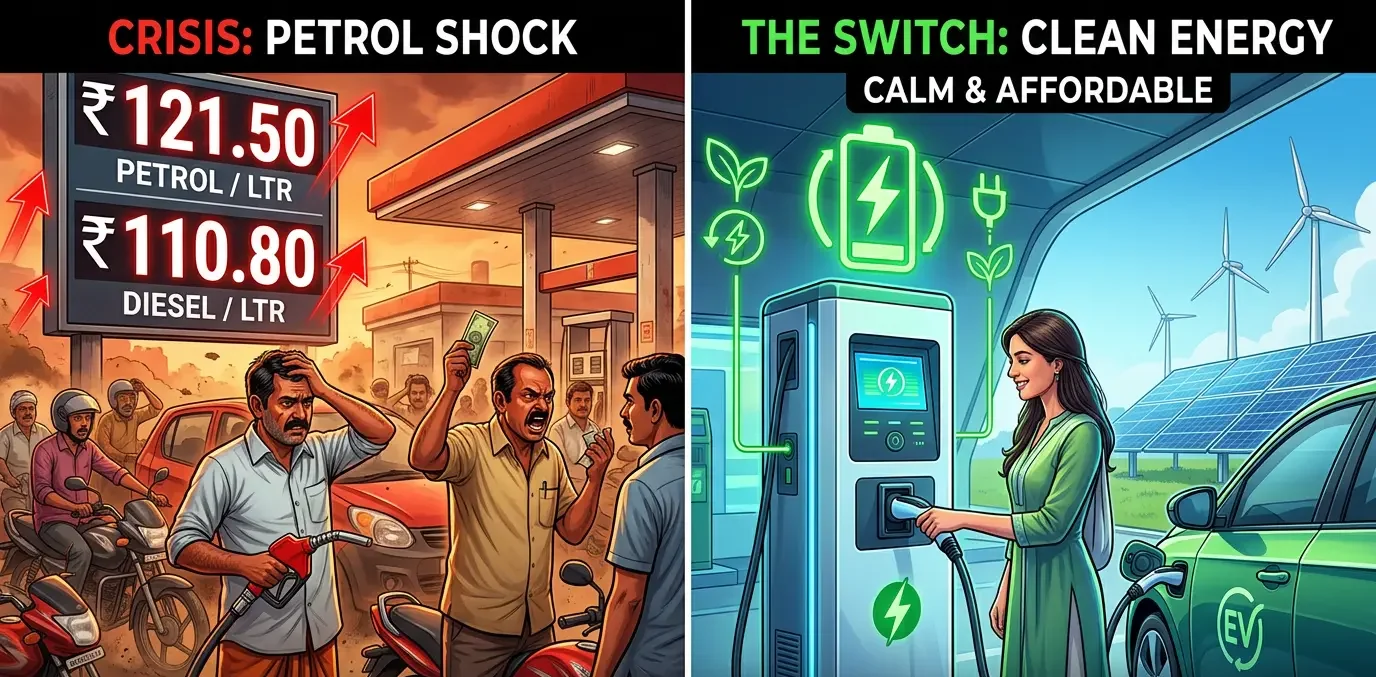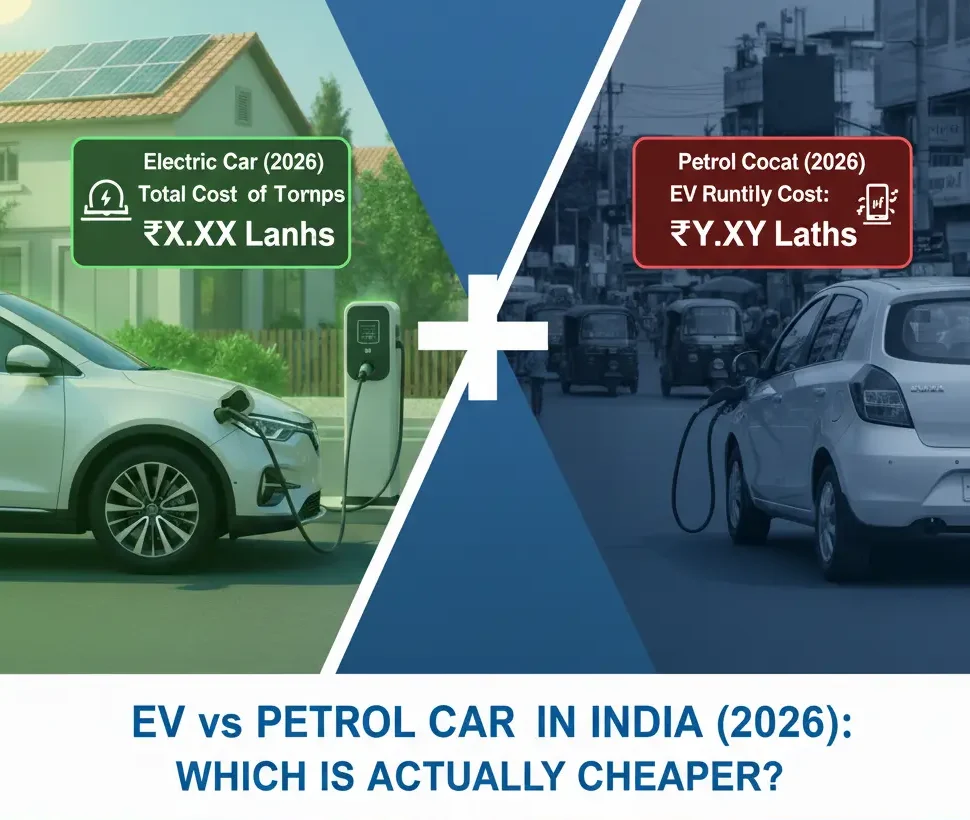
Think an EV is too expensive for India? Think again. At ₹105 per litre of petrol, an average Indian family spending ₹8,000–₹12,000 every month on fuel is unknowingly funding the most expensive way to travel — when a cheaper, cleaner option already exists in every showroom near them. EV vs Petrol Car in India (2026).
This is not a marketing piece. This is a data-driven, rupee-by-rupee breakdown of what it actually costs to own and run an Electric Vehicle versus a Petrol Car in India in 2026 — covering purchase price, fuel/charging, maintenance, insurance, resale, subsidies, and the all-important break-even point.
By the end of this article, you will know exactly whether switching to an EV makes financial sense for you — not for some average statistic, but for your commute, your state, your driving style.
Use the EV vs Petrol Cost Calculator at the top of this page to find out — enter your driving distance, your state’s electricity rate, your vehicle choice, and get your personalised 5-year saving in 30 seconds.
1. The Real Question: Total Cost vs Running Cost
Most “EV vs Petrol” articles make one of two mistakes:
Mistake 1 — Only comparing running cost. “EVs cost ₹1.50/km vs petrol’s ₹7/km — so EVs are cheaper!” This is true but incomplete. It ignores the higher upfront purchase price.
Mistake 2 — Only comparing sticker price. “This EV costs ₹8 lakh more than the petrol version — so it’s too expensive!” This is also misleading. It ignores 5 years of drastically lower fuel and maintenance bills.
The correct way to compare is Total Cost of Ownership (TCO) — the sum of everything you’ll spend over the life of the vehicle: purchase price, fuel/charging, maintenance, insurance, taxes, and what you’ll recover at resale.
When you do that calculation honestly, with 2026 Indian prices, the picture looks very different from what you might expect.
Let’s build that picture, number by number.
Use the EV vs Petrol Cost Calculator at the top of this page to find out — enter your driving distance, your state’s electricity rate, your vehicle choice, and get your personalised 5-year saving in 30 seconds.
2. Purchase Price: The Upfront Gap in 2026
Yes, EVs cost more to buy. That’s real and shouldn’t be dismissed. Here’s where the premium stands today:
Entry-Level Segment (Hatchback / Small Cars)
| Model | Variant | Ex-Showroom Price |
|---|---|---|
| Tata Tiago EV | XZ+ LR | ₹9,49,900 |
| Tata Tiago Petrol | XZ+ | ₹7,79,900 |
| Price Premium (EV over Petrol) | ₹1,70,000 | |
| Tata Punch EV | Adventure LR | ₹12,99,900 |
| Tata Punch Petrol | Adventure AMT | ₹9,29,900 |
| Price Premium | ₹3,70,000 |
Mid-Segment (Compact SUV)
| Model | Variant | Ex-Showroom Price |
|---|---|---|
| Tata Nexon EV | Long Range XZ+ | ₹17,49,900 |
| Tata Nexon Petrol | XZ+ AMT | ₹11,14,900 |
| Price Premium | ₹6,35,000 | |
| MG ZS EV | Exclusive | ₹22,99,900 |
| MG Hector Petrol | Sharp | ₹17,49,900 |
| Price Premium | ₹5,50,000 |
Premium Segment
| Model | Variant | Ex-Showroom Price |
|---|---|---|
| Hyundai Ioniq 6 | Standard | ₹44,99,900 |
| Hyundai Tucson Petrol | Platinum | ₹34,99,900 |
| Price Premium | ₹10,00,000 |
The honest truth about the price gap: After FAME-II subsidies (₹1.5 lakh for qualifying models), and before running cost savings, the effective premium shrinks. For a Tata Tiago EV, you’re paying just ₹20,000 more than its petrol sibling after subsidy — and then saving ₹5,000+ per month on fuel. That’s not expensive. That’s actually a bargain hiding behind a sticker price.
3. Fuel vs Charging: The Biggest Monthly Saving
This is where EV economics become undeniable. Let’s use precise 2026 numbers.
The Formula (Simple and Transparent)
Petrol cost per km:
= Petrol Price (₹/litre) ÷ Mileage (km/litre)
= ₹105 ÷ 15 km/l = ₹7.00 per km
EV cost per km (home charging):
= Electricity Rate (₹/kWh) ÷ Efficiency (km/kWh)
= ₹8 ÷ 6 km/kWh = ₹1.33 per km
Daily saving (50 km commute):
= (₹7.00 − ₹1.33) × 50 km = ₹283.50 per day
Monthly saving (1,500 km):
= ₹5.67 × 1,500 = ₹8,505 per month
Yearly saving:
= ₹8,505 × 12 = ₹1,02,060 per year
That is over ₹1 lakh saved per year — just on fuel. And that number only grows as petrol prices rise (which history tells us they reliably do every 2–3 years).
Monthly Fuel/Charging Cost by Vehicle (at 1,500 km/month)
| Vehicle | Cost Per Km | Monthly Energy Cost | Monthly Saving vs Petrol |
|---|---|---|---|
| Tata Nexon EV (home charging) | ₹1.33 | ₹1,995 | ₹8,505 |
| Tata Nexon Petrol | ₹7.00 | ₹10,500 | — |
| Tata Punch EV | ₹1.20 | ₹1,800 | ₹7,800 |
| Tata Punch Petrol | ₹6.40 | ₹9,600 | — |
| MG ZS EV | ₹1.40 | ₹2,100 | ₹9,600 |
| MG Hector Petrol | ₹7.80 | ₹11,700 | — |
| Citroen eC3 EV | ₹1.33 | ₹1,995 | ₹8,505 |
| Citroen C3 Petrol | ₹7.00 | ₹10,500 | — |
Petrol: ₹105/litre. Home charging: ₹8/kWh. Real-world efficiency (not ARAI rated).
What About Public Charging?
If you charge mostly at public DC fast-charge stations, the math changes:
| Charging Type | Rate | EV Cost Per Km | Monthly Cost (1,500 km) |
|---|---|---|---|
| Home (15A socket) | ₹6–9/kWh | ₹1.00–₹1.50 | ₹1,500–₹2,250 |
| AC Public Charger | ₹12–15/kWh | ₹2.00–₹2.50 | ₹3,000–₹3,750 |
| DC Fast Charger | ₹18–22/kWh | ₹3.00–₹3.67 | ₹4,500–₹5,505 |
The golden rule of EV ownership: Charge at home as much as possible. Even at the worst-case public charging rate, you still save ₹3,000–₹5,000/month over petrol. Home charging is the difference between saving ₹1 lakh/year and saving ₹60,000/year — both good outcomes, but home charging is clearly optimal.
4. State-Wise Electricity Rates: Your Location Changes Everything
Here is the factor that almost nobody talks about when comparing EVs to petrol — and it’s arguably the most important variable in your personal calculation.
India’s electricity tariffs are set by state DISCOMs (Distribution Companies) and vary dramatically. The same EV costs very different amounts to run in Delhi versus Maharashtra.
State-Wise EV vs Petrol Cost Comparison (2026)
| State | Electricity Rate (₹/kWh) | EV Cost/km | Petrol Price (₹/L) | Petrol Cost/km | Monthly Saving (1,500 km) | Annual Saving |
|---|---|---|---|---|---|---|
| Delhi | ₹3.00 (subsidised) | ₹0.50 | ₹105.40 | ₹7.03 | ₹9,795 | ₹1,17,540 |
| Uttar Pradesh | ₹6.00 | ₹1.00 | ₹107.00 | ₹7.13 | ₹9,195 | ₹1,10,340 |
| Tamil Nadu | ₹6.50 | ₹1.08 | ₹103.00 | ₹6.87 | ₹8,685 | ₹1,04,220 |
| Gujarat | ₹7.00 | ₹1.17 | ₹104.60 | ₹6.97 | ₹8,700 | ₹1,04,400 |
| Karnataka | ₹7.50 | ₹1.25 | ₹103.40 | ₹6.89 | ₹8,460 | ₹1,01,520 |
| Rajasthan | ₹8.00 | ₹1.33 | ₹108.50 | ₹7.23 | ₹8,850 | ₹1,06,200 |
| West Bengal | ₹8.50 | ₹1.42 | ₹106.00 | ₹7.07 | ₹8,475 | ₹1,01,700 |
| Maharashtra | ₹9.50 | ₹1.58 | ₹105.00 | ₹7.00 | ₹8,130 | ₹97,560 |
| Kerala | ₹7.00 | ₹1.17 | ₹106.30 | ₹7.09 | ₹8,880 | ₹1,06,560 |
| Telangana | ₹7.50 | ₹1.25 | ₹109.50 | ₹7.30 | ₹9,075 | ₹1,08,900 |
| Punjab | ₹7.00 | ₹1.17 | ₹103.70 | ₹6.91 | ₹8,610 | ₹1,03,320 |
| Haryana | ₹8.00 | ₹1.33 | ₹106.40 | ₹7.09 | ₹8,640 | ₹1,03,680 |
💡 Delhi is the best state in India to own an EV. With electricity subsidised at ₹3/unit and a robust charging network, Delhi EV owners save over ₹1.17 lakh per year on fuel alone — the most of any Indian state. This is why Delhi has the highest EV adoption rate per capita in the country.
How to find your exact electricity rate: Open your home electricity bill and look for “tariff slab” or “energy charge per unit.” For most urban households on a 4–6 kW connection, the applicable slab is ₹6–9/unit. Enter this number in the EV vs Petrol Calculator for your personalised saving.
5. Maintenance: The Hidden Goldmine of EV Savings
When people compare EV vs petrol costs, they almost always undercount this one. EV maintenance is dramatically cheaper — and the savings compound over years.
Why EVs Need So Much Less Maintenance
A petrol engine is a mechanical marvel of controlled explosions. Pistons, camshafts, crankshafts, timing belts, spark plugs, fuel injectors, catalytic converters — hundreds of parts working together, all subject to heat, friction, and wear.
An electric motor has one moving part — the rotor. No combustion. No oil. No exhaust. No gearbox (in most EVs). The simplicity translates directly into your wallet.
Annual Maintenance Cost Comparison
| Service Item | Frequency | Petrol Car Cost | EV Cost |
|---|---|---|---|
| Engine oil + oil filter change | Every 5,000–7,500 km | ₹3,500–₹5,000 | ❌ Not applicable |
| Air filter replacement | Annual | ₹400–₹700 | ❌ Not applicable |
| Spark plug replacement | Every 30,000 km | ₹1,500–₹3,000 | ❌ Not applicable |
| Fuel filter | Every 40,000 km | ₹1,000–₹2,000 | ❌ Not applicable |
| Coolant flush | Every 2 years | ₹1,500–₹2,500 | Minimal (motor cooling only) |
| Timing belt | Every 60,000 km | ₹5,000–₹12,000 | ❌ Not applicable |
| Transmission service | Every 40,000 km | ₹3,000–₹6,000 | ❌ Not applicable (single speed) |
| Brake pad replacement | Annual | ₹3,000–₹5,000 | ₹3,000–₹5,000 (lasts 2–3× longer due to regen braking) |
| Tyre rotation | Every 10,000 km | ₹500–₹800 | ₹500–₹800 |
| Annual Service (labour + parts) | Annual | ₹8,000–₹14,000 | ₹3,000–₹6,000 |
| Total Annual Maintenance | ₹16,000–₹28,000 | ₹5,000–₹8,000 |
5-year maintenance saving: ₹55,000 – ₹1,00,000 depending on the vehicle and brand.
This number alone is enough to make the financial case for EVs in the sub-₹15 lakh segment where the price premium is under ₹3 lakh.
Note on battery replacement: Most EV manufacturers in India offer 8-year / 1.6 lakh km battery warranty. In a 5-year ownership cycle, battery replacement is not a realistic cost to plan for. Modern LFP batteries (used in Tata EVs, for example) show less than 5% capacity degradation after 1 lakh km of real-world use.
6. Insurance: Does an EV Cost More to Insure? {#insurance}
Slightly, yes — but the difference is smaller than most people expect.
EV insurance premiums are higher primarily because:
- The declared value (IDV) of the vehicle is higher
- Battery replacement cost is factored into the insured sum
- EV-specific add-ons (battery protection, charging equipment cover) are available
Approximate Annual Insurance Premium (Comprehensive)
| Vehicle | Approx. IDV | Annual Premium |
|---|---|---|
| Tata Nexon EV (Long Range) | ₹15,50,000 | ₹32,000–₹38,000 |
| Tata Nexon Petrol | ₹9,00,000 | ₹22,000–₹27,000 |
| Annual Difference | ₹8,000–₹14,000 higher for EV | |
| Tata Tiago EV | ₹8,20,000 | ₹18,000–₹22,000 |
| Tata Tiago Petrol | ₹6,50,000 | ₹15,000–₹18,000 |
| Annual Difference | ₹3,000–₹5,000 higher for EV |
Over 5 years, the insurance premium difference adds ₹15,000–₹40,000 to the EV’s total cost — real, but easily outweighed by fuel and maintenance savings.
One important note: Several insurers including Tata AIG, Bajaj Allianz, and HDFC ERGO now offer EV-specific policies with better terms and battery coverage. Get quotes from at least 3 providers before renewing.
7. Resale Value: What Happens After 5 Years?
This is the one area where EVs in India face genuine uncertainty — and it’s worth being honest about.
Current Resale Scenario (2025–26 Data)
Petrol cars have a well-understood depreciation curve. A 5-year-old mid-segment petrol car retains roughly 50–60% of its original ex-showroom value in India.
EVs are newer to the Indian used car market. Resale value varies significantly based on:
- Battery health — the most important factor. A battery at 85%+ capacity commands strong resale.
- Brand trust — Tata EVs are increasingly holding value well due to widespread service network.
- Technology generation — older range EV models (pre-2022) fetch less; newer long-range models are holding better.
Current EV Resale Estimates (5-Year)
| Model | Original Price | Estimated 5-Yr Resale | Retention % |
|---|---|---|---|
| Tata Nexon EV (2021) | ₹14,99,900 | ₹7,00,000–₹8,50,000 | 47–57% |
| Tata Tigor EV | ₹11,99,900 | ₹5,50,000–₹6,50,000 | 46–54% |
| MG ZS EV (2020) | ₹20,99,900 | ₹9,00,000–₹11,00,000 | 43–52% |
| Nexon Petrol (2021) | ₹9,99,900 | ₹5,50,000–₹6,50,000 | 55–65% |
The honest verdict: Current EV resale retention is slightly lower than petrol in percentage terms. However, because of dramatically lower running costs, an EV owner who’s saved ₹5–₹6 lakh over 5 years is still ahead overall — even if the resale realises ₹1–₹1.5 lakh less than a petrol equivalent.
As EV adoption grows and the used EV market matures (2026–27 onwards), this gap is expected to narrow and potentially reverse as petrol car demand drops.
8. FAME-II & State Subsidies: Free Money You Shouldn’t Miss
India’s subsidy structure for EVs is one of the most aggressive in Asia. Missing out on this is leaving real money on the table.
Central Government: FAME-II (Phase 2)
| Vehicle Category | Maximum Subsidy |
|---|---|
| Electric Cars (qualifying models) | Up to ₹1,50,000 |
| Electric Two-Wheelers | Up to ₹25,000 (₹10,000/kWh, max 3 kWh) |
| Electric Three-Wheelers | Up to ₹50,000 |
| Electric Buses | Up to ₹20 lakh |
To qualify, the vehicle must be manufactured in India with a minimum 50% local content. Most Tata, MG, Hyundai, and two-wheeler EVs from Ola, Ather, TVS, and Bajaj qualify.
State-Level Subsidies (Additional on Top of FAME-II)
| State | Car Subsidy | Two-Wheeler Subsidy | Extra Benefits |
|---|---|---|---|
| Delhi | ₹1,50,000 | ₹5,000 (+ ₹2,000/kWh) | Full road tax waiver + free registration |
| Maharashtra | ₹2,50,000 (limited) | ₹25,000 | GST reduction on first 1 lakh EVs |
| Gujarat | ₹1,50,000 | ₹20,000 | Subsidised home charger installation |
| Tamil Nadu | ₹1,00,000 | ₹15,000 | 100% road tax exemption |
| Rajasthan | ₹50,000 | ₹10,000 | Motor vehicle tax waiver |
| Uttar Pradesh | ₹1,00,000 | ₹5,000 | Registration fee waiver |
| Telangana | ₹1,00,000 | ₹10,000 | Road tax exemption |
| Karnataka | ₹25,000 | ₹10,000 | Waived registration fee |
Combined Subsidy Example: Delhi Buyer, Nexon EV Long Range
| Item | Amount |
|---|---|
| Ex-showroom price | ₹17,49,900 |
| FAME-II central subsidy | −₹1,50,000 |
| Delhi state subsidy | −₹1,50,000 |
| Road tax (waived) | −₹1,74,990 (saved) |
| Registration (free for EV) | −₹20,000 (saved) |
| Effective Price Paid | ₹12,54,910 |
| Nexon Petrol equivalent price | ₹11,14,900 |
| Real premium after all subsidies | ₹1,40,010 |
For just ₹1.4 lakh more than a Nexon Petrol, a Delhi buyer gets a car that saves them ₹9,795 per month in fuel. Break-even in just 14 months. This is why Delhi has the highest EV penetration in the country.
9. Complete 5-Year TCO: Head-to-Head Model Comparison
Now let’s put it all together — the full 5-year Total Cost of Ownership for the most popular head-to-head comparisons in India.
Assumptions:
- Monthly driving: 1,500 km
- Home charging: 80% | Public charging: 20%
- Effective EV charging rate: ₹9.20/kWh blended
- Petrol price: ₹105/litre (no inflation adjustment — conservative)
- Annual maintenance figures from authorised service centres
Tata Nexon EV (Long Range XZ+) vs Nexon Petrol (XZ+ AMT)
| Cost Element | Nexon EV | Nexon Petrol |
|---|---|---|
| Purchase Price (ex-showroom) | ₹17,49,900 | ₹11,14,900 |
| FAME-II Subsidy | −₹1,50,000 | — |
| Effective Purchase Price | ₹15,99,900 | ₹11,14,900 |
| Fuel/Charging — 5 years (90,000 km) | ₹1,38,000 | ₹6,30,000 |
| Maintenance — 5 years | ₹30,000 | ₹90,000 |
| Insurance — 5 years | ₹1,65,000 | ₹1,20,000 |
| Estimated Resale (after 5 yrs) | −₹7,50,000 | −₹5,75,000 |
| Net 5-Year Spend | ₹11,82,900 | ₹13,79,900 |
| 5-Year Saving with EV | ₹1,97,000 | — |
Verdict: Nexon EV saves ₹1.97 lakh over 5 years at average usage — and this is without state subsidies. Add Delhi’s ₹1.5 lakh state subsidy and the saving jumps to ₹3.47 lakh.
Tata Tiago EV (XZ+ LR) vs Tiago Petrol (XZ+)
| Cost Element | Tiago EV | Tiago Petrol |
|---|---|---|
| Effective Purchase Price (after FAME-II) | ₹7,99,900 | ₹7,79,900 |
| Fuel/Charging — 5 years | ₹1,12,500 | ₹5,40,000 |
| Maintenance — 5 years | ₹25,000 | ₹75,000 |
| Insurance — 5 years | ₹95,000 | ₹75,000 |
| Estimated Resale | −₹4,00,000 | −₹3,50,000 |
| Net 5-Year Spend | ₹6,32,400 | ₹10,19,900 |
| 5-Year Saving with EV | ₹3,87,500 | — |
Verdict: Tiago EV saves nearly ₹3.88 lakh over 5 years. This is the strongest financial case for an EV in the sub-₹10 lakh segment. The effective price premium after subsidy is just ₹20,000 — an almost negligible gap for the fuel savings on offer.
MG ZS EV (Exclusive) vs Hyundai Creta Petrol (SX(O) DCT)
| Cost Element | MG ZS EV | Creta Petrol |
|---|---|---|
| Effective Purchase Price | ₹21,49,900 | ₹19,69,900 |
| Fuel/Charging — 5 years | ₹1,57,500 | ₹7,56,000 |
| Maintenance — 5 years | ₹35,000 | ₹1,05,000 |
| Insurance — 5 years | ₹1,90,000 | ₹1,60,000 |
| Estimated Resale | −₹10,00,000 | −₹10,50,000 |
| Net 5-Year Spend | ₹15,32,400 | ₹19,40,900 |
| 5-Year Saving with EV | ₹4,08,500 | — |
Verdict: ZS EV saves over ₹4 lakh versus Creta Petrol in 5 years — despite the higher insurance cost and a slight resale disadvantage.
10. The Break-Even Point: When Does Your EV Pay Off?
Here is the formula every potential EV buyer needs to know:
Break-Even (months) = Price Premium ÷ Monthly Savings (fuel + maintenance)
Break-Even by Monthly Driving Distance
| Monthly KMs | Monthly Saving (Nexon EV vs Petrol) | Break-Even at ₹4.85L premium |
|---|---|---|
| 800 km/month | ₹5,070 | ~96 months (8 years) |
| 1,000 km/month | ₹6,340 | ~77 months (6.4 years) |
| 1,200 km/month | ₹7,605 | ~64 months (5.3 years) |
| 1,500 km/month | ₹9,505 | ~51 months (4.3 years) |
| 2,000 km/month | ₹12,670 | ~38 months (3.2 years) |
| 2,500 km/month | ₹15,840 | ~31 months (2.6 years) |
| 3,000 km/month | ₹19,005 | ~26 months (2.2 years) |
Monthly saving includes fuel saving + maintenance saving (~₹1,000/month). Premium after FAME-II: ₹4,85,000.
For the average Indian commuter doing 1,500 km/month, an EV pays back in about 4.3 years — within the typical car ownership cycle of 5–7 years. High-mileage users (cabs, delivery, long commuters) break even in under 3 years.
Use the EV vs Petrol Cost Calculator on this page to enter your exact driving distance and see your personal break-even month.
11. Real Stories: What EV Owners in India Are Actually Saving {#real-stories}
Numbers in tables are convincing. Real people are more convincing.
Ankit Sharma, Delhi — Tata Nexon EV, 2,200 km/month
“My previous Creta was costing me ₹14,000–₹16,000 in petrol every month. After switching to the Nexon EV with home charging at ₹3/unit, my monthly electricity bill went up by just ₹2,800. I’m saving ₹12,000 every single month. The car paid for the price difference in less than 3 years. My only regret is not switching sooner.”
Priya Venkataraman, Chennai — Ather 450X, 1,800 km/month
“I was spending ₹5,500 on petrol every month for my Activa. Now I spend ₹2,200 on home charging for the Ather. That’s ₹3,300 saved per month. Add zero oil changes, zero service costs beyond annual maintenance — I’m saving easily ₹45,000 a year. On a ₹1.5 lakh scooter, that’s a 3-year break-even easily.”
Ravi Kulkarni, Pune — Tata Tiago EV, 1,400 km/month (family car)
“My wife uses the Tiago EV for school runs and grocery. We charge at home on a standard 15A socket — no special installation. Monthly electricity increase is ₹1,600. We were spending ₹7,500 on petrol. Monthly saving: ₹5,900. Annualised: ₹70,800. It surprised us how dramatically the numbers change with home charging.”
These are representative accounts from the EVCommunity.in member forum. Individual results vary with driving habits, local electricity rates, and vehicle condition.
12. Who Should Buy an EV in 2026 — Honest Recommendation
The EV vs Petrol decision is not the same for everyone. Here is an honest breakdown:
✅ Strong Case for EV — Buy Now If You:
- Drive more than 1,500 km/month — every extra km compounds your savings
- Have home or society-level charging — a 15A socket or a dedicated EV charger in your parking spot
- Live in Delhi, UP, Tamil Nadu, Karnataka, or Gujarat — state subsidies + favourable tariffs
- Are buying a two-wheeler — price premium is small, break-even is fast (under 3 years in most cases)
- Do predictable city commuting — stop-start traffic is actually ideal for EV efficiency (regenerative braking harvests energy)
- Are buying for professional use (cab, delivery, rideshare) — highest mileage = fastest payback
⏳ Hold On — Evaluate Carefully If You:
- Drive less than 800 km/month — savings are real but break-even stretches beyond 7 years
- Have no home charging option — if you rely 100% on public charging, savings narrow significantly
- Make frequent long-distance trips (400+ km) — while the charging network is improving, planning is still required
- Are in a small town or rural area with no EV service centre nearby for your chosen brand
- Are considering a budget under ₹8 lakh — EV options are expanding but still limited at this price point
❌ Wait for Next Cycle If:
- You need 7-seater or full-size SUV — EV options in this segment are still premium-priced (above ₹35–40 lakh) and the economics favour waiting
- You drive mixed highway + city at high speed — EVs lose efficiency at 100+ km/h, reducing the savings advantage on pure highway use
13. Frequently Asked Questions
Is an EV actually cheaper than a petrol car in India in 2026?
Yes — definitively, when compared over 5 years. While the upfront purchase price of an EV is higher by ₹1.5–₹6 lakh depending on the model, the running cost is 5–6 times lower (₹1.30–₹1.50/km for EV vs ₹6.50–₹7.50/km for petrol), and maintenance costs are 60–70% lower. For anyone driving more than 1,200 km/month, the EV is cheaper in total cost of ownership within 4–5 years.
What is the running cost of an EV per km in India?
At home charging rates (₹6–9/unit), the average EV costs ₹1.00 to ₹1.58 per km in India depending on your state’s electricity tariff. At public DC fast chargers (₹18–22/unit), the cost rises to ₹3.00–₹3.67/km — still cheaper than petrol but with reduced savings margin.
Which is better — EV or petrol car for Indian conditions?
For city driving, regular commuting, and monthly distance above 1,000 km, EVs are clearly better economically and offer a superior driving experience (instant torque, quieter cabin). For long intercity trips and rural areas, petrol cars still have an advantage due to fuel availability and range certainty.
How much does it cost to charge an EV at home in India?
For a typical EV with a 30 kWh battery (like Tata Nexon EV standard range), a full charge at home costs ₹180–₹270 depending on your state’s electricity rate (₹6–9/unit). This gives you roughly 200–240 km of real-world range — equivalent to spending ₹1,400–₹1,700 worth of petrol for the same distance.
What is the break-even point for an EV in India?
At an average commute of 1,500 km/month, most mid-segment EVs (like Nexon EV) break even with their petrol equivalents in 4–5 years after accounting for the price premium. For high mileage drivers doing 2,500+ km/month, break-even can be as fast as 2.5–3 years. Use our EV vs Petrol Calculator to calculate your exact break-even based on your actual numbers.
Does FAME-II subsidy still apply in 2026?
India’s EV subsidy framework continues to evolve. FAME-II and its successor schemes provide benefits of up to ₹1.5 lakh for qualifying electric cars and ₹25,000 for electric two-wheelers. Additionally, many states offer their own subsidies, road tax waivers, and registration fee exemptions. Confirm eligibility at the time of purchase with your dealer and check the official FAME portal.
What happens to EV battery after 5 years?
Most EV manufacturers in India offer an 8-year / 1.6 lakh km battery warranty — meaning battery failure or capacity drop below a specified threshold is covered within this period. Real-world data from Indian EV owners shows less than 8–10% capacity degradation after 4–5 years and 1 lakh km of use, with LFP chemistry (Tata EVs) performing especially well in Indian temperatures.
Is home charging safe? Do I need special installation?
A standard 15-amp socket found in most Indian homes is sufficient to charge most EVs overnight (adds 8–12 km of range per hour — enough for 60–80 km daily in 8 hours). For faster charging, a 32-amp AC wallbox (costing ₹8,000–₹15,000 installed) gives 3–4× the speed. Both options are completely safe with proper earthing and a circuit breaker, which most urban homes already have.
What is the difference between EV cost per km and total cost of ownership?
Cost per km (running cost) is just the fuel/charging expense: typically ₹1.30–₹1.50/km for EVs vs ₹6.50–₹7.50/km for petrol cars. Total Cost of Ownership (TCO) adds the purchase price, maintenance, insurance, and subtracts resale value. TCO is the complete picture and the correct metric for a buying decision. Our calculator above shows both.
Conclusion: The 2026 Verdict on EV vs Petrol Car India
In 2026, the financial argument for electric vehicles in India is stronger than it has ever been.
Petrol prices are high and structurally unlikely to fall. Electricity prices, while varying by state, are governed by regulated tariffs and far less volatile. The EV model range has expanded from a novelty into a genuine mainstream choice with strong after-sales support.
The numbers are clear:
- ₹1 lakh+ saved per year on fuel for a typical 1,500 km/month driver
- ₹50,000–₹1,00,000 saved on maintenance over 5 years
- Break-even in 3–6 years depending on your mileage and state
- Government subsidies reducing the upfront premium to near-zero in some segments
The question is no longer “Can India afford EVs?” The question is: “Can you afford not to calculate what you’re losing by staying on petrol?”
Use the EV vs Petrol Cost Calculator at the top of this page to find out — enter your driving distance, your state’s electricity rate, your vehicle choice, and get your personalised 5-year saving in 30 seconds.
Note: Calculations are estimates. Actual costs may vary based on usage patterns and local rates.
📅 Article published: February 2026 | Based on current Indian ex-showroom prices, DISCOM tariff data, and manufacturer warranty terms.
📌 Data sources: Ministry of Heavy Industries (FAME-II), state DISCOM official tariff schedules, Indian Oil Corporation fuel price data, authorised service centre maintenance cost averages, Cardekho / CarWale used vehicle valuations.
Note: Calculations are estimates. Actual costs may vary based on usage patterns and local rates.